| Learner | Study hours | Score |
|---|---|---|
| 1 | 1 | 48 |
| 2 | 2 | 55 |
| 3 | 2 | 51 |
R Workshops for Social Scientists
Learn by predicting, running, inspecting, explaining, and modifying.
RWSS is a learning series of four courses introducing practical R and the range of questions it can help social scientists explore. Begin with everyday data work, then try statistical methods, new forms of data, and research outputs. The emphasis is on understanding a small application, rather than mastering every method formally.
Two ways to use the materials
All materials brings all four courses together in one continuous view. The course tabs let you select one module and use its subsection menu to focus on that lesson. Both views contain the same explanations, examples, exercises, worked answers, and downloads. Switching views changes the layout, not the content. Planned modules are marked in both views.
In the full reader, section numbers identify the course and module: 2.2 corresponds to Course 2, Module 2. Within each course, modules keep their local numbering.
NoteAvailable now
The first R module and linear-regression module are bilingual pilots. The 48-module map describes the full planned sequence; its remaining 46 modules have not yet been authored. The regression pilot assumes the foundation skills, so it is not the immediate next step for a new R user.
Choose a course
Course 1 · 12 modules · Authoring priority
Course 2 · 12 modules · Develop later
Course 3 · 12 modules · Authoring priority
Course 4 · 12 modules · Develop later
Each module is designed for about two hours of study, including local R practice. Modules are learning units rather than calendar weeks; study at your own pace. The first course assumes no R experience. Regression assumes basic statistics and R. Computational Social Science assumes prior regression training and R skills. Programming assumes basic R. Equivalent knowledge is acceptable. Data Preparation and Computational Social Science are the authoring priorities; Regression and Programming will be developed later.
What could you make?
The following small, finished examples all use fictional teaching data. They are previews of research tasks, not empirical findings. Open each example to inspect its prepared output. All R calculations were performed when the page was built.
A clean table
A row represents a learner; a column represents an attribute. An explicit identifier helps us combine tables later.
A visualization
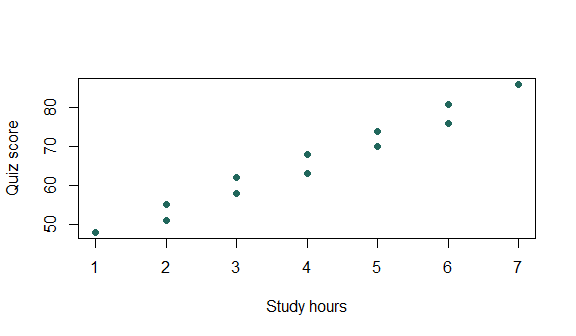
A plot makes variation visible. Learners with equal study time do not necessarily have equal scores.
A prediction
A model produces predictions we must interpret in context. These fitted scores are not guarantees for individual learners.
| Study hours | Predicted score |
|---|---|
| 3 | 59.68 |
| 4 | 66.00 |
Text and documents
Suppose three fictional interview notes read “library bus”, “school bus”, and “library”. Counting words gives a small summary, but removes their context. OCR would add another task: checking whether those words were read correctly from a scan.
| Word | Count |
|---|---|
| bus | 2 |
| library | 2 |
| school | 1 |
Relations between people
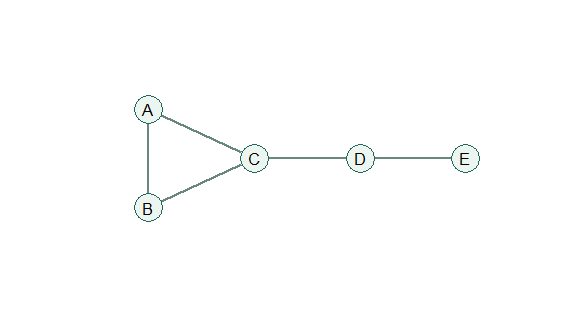
An edge list records who is connected to whom. Maps use geographic relations; networks can represent other relations. Here, five fictional people and five undirected ties illustrate a network.
An interactive report
These disclosure panels switch between prepared views without running R in your browser. Selecting a view changes what is displayed, not the underlying records. A larger dashboard can organize related plots and tables in the same way.
Whole class
| Learners | Mean score |
|---|---|
| 12 | 66 |
Compare study-time groups
| Study-time group | Mean score |
|---|---|
| More than 3 hours | 74.0 |
| Up to 3 hours | 54.8 |
Grouping describes these records. It does not turn the difference into an effect of studying.
How learning works here
Read a short explanation, predict a result, run a few lines locally, inspect the output, explain it, and modify one thing. Browser questions give feedback; hints and worked answers remain available. Open-ended interpretations use discussion and model answers.
You need R and a local editor for coding activities. The website itself needs no R service, login, or submitted scores. Image analysis and C++ acceleration are short demonstrations; most other topics include guided practice.
Start with Course 1, Module 1 · Explore all 48 modules · Instructor guide